 国际站
国际站 在审阅大量的英文学术论文初稿时,审稿人最容易产生视觉疲劳的地方,往往是“结果与讨论 (Results and Discussion)”部分。
许多非母语作者在面对辛辛苦苦做出来的图表时,仿佛患上了词汇匮乏症。整整两页纸的数据分析,满篇全是毫无波澜的:
-
"Figure 1 shows..."
-
"Table 2 shows..."
-
"As shown in Figure 3..."
这种干瘪的表述不仅显得学术词汇量匮乏,更致命的是,它无法精准传达数据背后的动态变化与深层逻辑。一篇高水平的学术论文,其数据解读应当是精准、丰富且极具逻辑张力的。本文将为您彻底拆解图表描述的四大核心场景,并提供可以直接套用的高阶替换句型。
引出客观图表:突破 Shows 的词汇围城
在引导读者观看特定的图表时,请立刻将 "show" 关进小黑屋。根据图表所呈现的内容类型,您可以选用更精准的动词。
高阶动词替换库:
-
呈现/说明 (客观展示):illustrate, present, demonstrate, display.
-
描绘/刻画 (细节刻画):depict, outline, characterize.
-
揭示/表明 (带有发现意味):reveal, indicate, suggest.
实战句式升级:
-
初阶:Figure 1 shows the relationship between temperature and pressure.
-
高阶 1 (主动式):Figure 1 illustrates the correlation between temperature and pressure.
-
高阶 2 (被动倒装,更显客观):As depicted in Figure 1, there is a strong correlation between...
-
高阶 3 (主语物化):A clear pattern emerges from the data presented in Table 2, indicating that...
描绘数据趋势:精准捕捉动态变化
在描述折线图或时间序列数据时,仅仅使用 "increase" 或 "decrease" 是远远不够的。您需要用词汇来体现变化的“幅度”与“速度”。
上升趋势的高级表达:
-
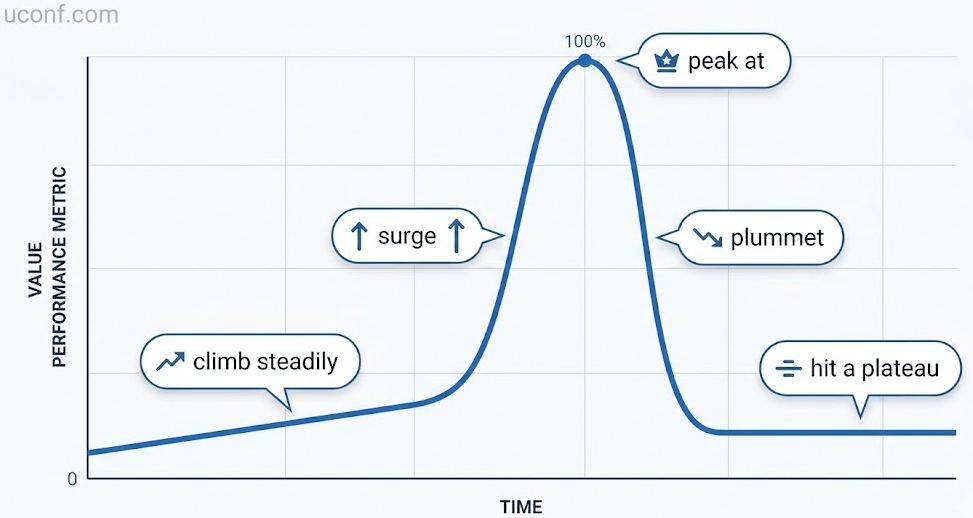
缓慢/稳步上升:climb steadily, experience a gradual upward trend.
-
急剧/显著上升:surge, skyrocket, witness a dramatic spike.
-
到达顶峰:peak at, reach a maximum of.
-
例句:The efficiency experienced a substantial surge, eventually peaking at 95.5%.
下降趋势的高级表达:
-
缓慢下降:decline progressively, show a downward trajectory.
-
暴跌/骤降:plummet, plunge, drop significantly.
-
触底:hit a trough, bottom out.
-
例句:After the initial phase, the error rate plummeted to an unprecedented low.
平稳与波动的表达:
-
保持平稳:level off, hit a plateau, remain relatively stable.
-
上下波动:fluctuate, oscillate.
-
例句:The output voltage hit a plateau after 10 milliseconds, maintaining a stable state.
突出对比与差异:建立强大的逻辑对照
如果您的图表包含实验组与对照组(如柱状图),比较两者差异是数据分析的核心。不要总是用 "A is bigger than B"。
强调优势与碾压:
-
超越/优于:outperform, yield superior results compared to, surpass.
-
例句:The proposed model significantly outperforms the baseline methods in terms of accuracy.
强调反差与对比:
-
鲜明对比:exhibit a striking contrast, show a marked difference.
-
例句:In striking contrast to the control group, the treated samples exhibited remarkable resilience.
表达差距的程度:
-
微小差距:a marginal difference, a negligible gap.
-
巨大差距:a substantial margin, a pronounced disparity.
-
例句:The proposed algorithm reduced the computational cost by a substantial margin of 40%.
挖掘深层机理:从“是什么”跨越到“为什么”
高水平的 Data Interpretation 绝不是把图表里的数字用英文重写一遍(那是机器干的活),而是要解释数据为什么会这样呈现。
推测因果关系的高频句型:
-
归因于...:This phenomenon can be largely attributed to... / This is primarily driven by...
-
潜在解释是...:A plausible explanation for this trend is that... / This behavior stems from the fact that...
-
这暗示了...:This unexpected drop strongly suggests/implies that...
实战综合段落演示:
"As illustrated in Figure 4, the algorithm's performance experienced a dramatic surge during the initial training phase. However, the learning curve eventually hit a plateau at epoch 50. This stagnation can be primarily attributed to the vanishing gradient problem, which suggests that further optimization of the activation function is required."
掌握了这些词汇和句型框架,您的数据分析段落将彻底摆脱干瘪的描述,呈现出极具逻辑深度与学术审美的专业质感。